€5.5 billion earnings from overseas visitors, including payment to Irish carriers, a 17% year on year increase in current terms.
€4.2 billion spent within the country, up 19% in current terms on the previous year.
Irish air and sea carriers earned €1.3 billion in fares paid by international visitors.
€538 average spend per visit, excluding fares paid to Irish carriers, up 5% on the previous year.
7.75 million overseas visitors came to Ireland in 2015, up 13% (excluding day visits)
921,000 more staying visitors in 2015 compared to 2014.
7.1 nights was the average length of stay, down marginally.
61 million bednights spent in the country by visitors from overseas, up 12%.
894,000 same day visits, up 15% (includes transfer passengers via Dublin Airport)
90% of visitors arrived by air with their numbers increasing by 15%, while arrivals on ferries remained unchanged.

Source: CSO


Source: CSO


Overseas visitor numbers hit a new high in 2015, surpassing the previous record year of 2007. The number of arrivals was up 14% year on year while revenue increased by a remarkable 19%.

The results for 2015, which far exceeded official forecasts, benefitted from a favourable external environment including improved economic and consumer confidence in the main source markets coupled with the strength of the US dollar and the pound sterling. The competitive positioning of the Ireland offering continued to be good, although under rising cost pressures, while the carriers embarked on a bullish expansionist strategy with increased capacity and highly competitive fares.

The degree to which pent up demand in the marketplace contributed to the double digit growth is unknown. Ironically the fillip in demand follows a number of years of a decline in state investment in destination marketing, which over time is bound to have an adverse impact on growth – already there is evidence of Ireland losing share of voice in key markets.

The growth in arrivals was driven largely by a 20% increase in holiday visitors with a 28% increase in their associated expenditure in the country. This is especially heartening as it is this segment of the market which is the primary target of the state funded destination marketing campaigns. Private investment by tourism businesses in online and in market promotions is also reported to have expanded in scale and effectiveness in recent years as trading improved.

Income from overseas visitors is the primary metric of economic benefit to the country. While monthly volume results are widely publicised estimates of the value of tourism and key visitor profile characteristics are limited to quarterly reports. The most recent publication from the CSO Tourism and Travel Quarter 4 2015 (released March 14, 2016) provides the basis for a detailed analysis of the demand from overseas markets. The analysis shows up some interesting insights and provides some valuable pointers for further investment.

€5.5 billion in earnings from overseas tourists in 2015

Aggregate earnings from foreign tourists to the Irish economy in 2015 amounted to €5.53 billion, a 17% increase in current terms on 2014.

€4.2 billion was spent within the country by staying and day visitors from overseas, while Irish carriers earned an estimated €1.3 billion from visitors travelling to Ireland.


OVERSEAS VISITORS TO IRELAND 2007 - 2015
YEAR
No. of Visits 000s (1)
Spend € millions (2)
Average spend per visit
Average length of stay (nights)
2007
7,590
3,920
€516
7.3
2008
7,288
3,834
€526
8.1
2009
6,470
3,410
€527
7.6
2010
5,700
2,976
€522
7.8
2011
6,023
2,864
€475
7.7
2012
6,039
2,882
€477
7.4
2013
6,396
3,227
€504
7.3
2014
6,828
3,507
€514
7.2
2015
7,749
4,169
€538
7.1
Source: CSO

Notes: Due to methodological changes there is a slight discontinuity with pre-2009 data.

(1)
- Visits refer to staying at least overnight (excludes arrivals via Northern Ireland)
(2) - Est. spend for staying visitors excludes fares paid to Irish carriers


Spending by overseas visitors increased by €662m to reach €4.2 billion in 2015, excluding fares paid to Irish carriers. The 19% year on year increase in current terms is likely to have benefitted businesses throughout the country.

In value terms continental Europe continues to be the most valuable source market netting €1.6 billion, up 19% on the previous year. Visitor spending by North Americans has been growing faster than from other markets in recent years and boosted by a strong dollar increased by 28% to reach €1.2 billion last year. Spending by visitors from Britain reached €970 million last year, a 10% year on year increase although despite the strength of sterling the average spend per visit declined marginally. Earnings from visitors from the rest of the world continued to grow in importance with a 15% increase in receipts to €483 million.

A longer term perspective shows that over that past 4 years the increase in earnings has been strongest from long haul markets. Since 2012 the annual spend by long haul visitors has grown by 63%, with annual earnings from North America up 61% and the rest of the world up 68%. In contrast earnings from short haul markets have increased by 34% over the same period, with continental Europeans annual spend up 46% and British spend up 18%.

In recent years the return on marketing investment would appear to have been particularly strong from long haul markets which account for 24% share of visitors but generate 40% of annual receipts.


Source: CSO


€2.3 billion was spent in the country by holiday visitors which was up 28% on the previous year and accounted for 55% of total earnings. Expenditure by VFR (visiting friends and relatives) increased by 2% to €800m, while spending by business visitors was up 15% to €675m.

Average expenditure per visit

The average spend per visit in 2015 is estimated at €538, compared to €514 a year earlier. The average spend varies considerably depending on the visitor’s country of origin and purpose of visit. On average a holiday/leisure visitor spent €596 in the country, with business and VFR visitors spending on average €539 and €359 respectively. It would appear that the average expenditure per trip for holiday and business visitors increased from the previous year with VFR average spend per trip largely unchanged.

The highest spenders per trip are visitors from long-haul markets, with Australians and New Zealanders topping the chart at an average of €966, followed by visitors from new emerging long-haul markets spending on average €855, down marginally on year earlier. North American visitors are in third place in the league of trip expenditure spending an average of €791 in 2015, up 12% helped by a strong dollar. Germans continue to be top Europeans spenders with an average trip expenditure in Ireland of €631, while the majority of other Europeans spend around €500 per visit. British visitors with shorter average stays in the country spend the least per visit, an average of €274, down on the previous year despite a relatively stronger pound.

Overall looking at 2015 data for overseas visitors, the daily average expenditure rose by 4% to 5% for most markets with the exception of a marginal drop by British and rest of the world visitors, and a 7% decline in the average daily expenditure by Italian visitors. A note of caution may be appropriate based on survey sample sizes.


Source: Derived from CSO


  • 3.9 million holiday visits was up 20% on the previous year producing an additional 650,000 trips. 2015 was the third successive year of growth in holiday visits and for the first time ever this segment now accounts for just over half of all arrivals.
  • Visiting friends and relatives (VFR) while continuing to be an important component of overseas demand in recent years it has been declining in relative importance. Last year this segment grew by 4% to 2.2 million visits.
  • Demand for business visits was more buoyant in 2015 than in the previous year increasing by 12% to 1.25 million visits, excluding day business trips.
  • Visits for other reasons are estimated to have increased by 11% to 352,000 staying visits.

Source: CSO


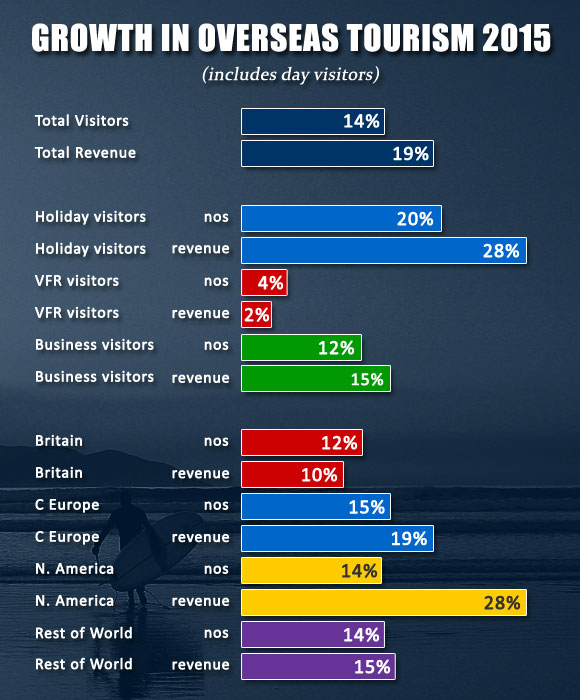
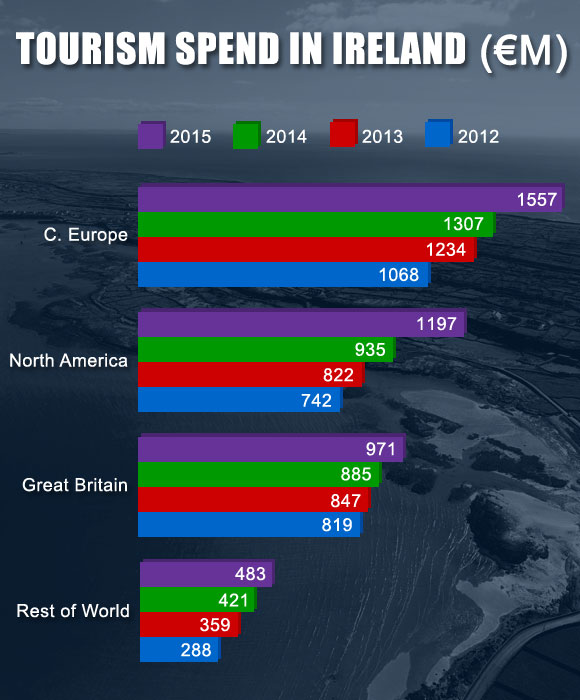
Of the total estimated 3.9 million holiday visitors that came to Ireland in 2015, Continental Europe continued to be the largest source with an estimated 1.6 million trips accounting for 41% of the total by volume. Britain is the next largest source of holiday visitors with an estimated 1.2 million trip accounting for 30% of the total. North America at close to 900,000 holiday visits was the source of 23% of the total, while the rest of the world with 6% share resulted in close to a quarter of a million trips.

Source: CSO


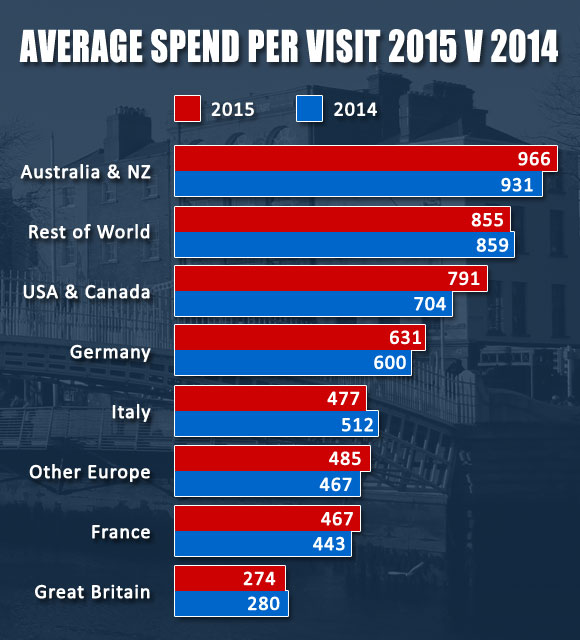
Germany is the top mainland European source market, accounting for 11% of all holiday visits, followed by France the source of 8% of the demand.

The absolute and relative importance of the source markets for holidays in Ireland has changed significantly over recent years as demand from Britain declined. Over the past 7 years the shift has occurred as demand grew from markets beyond Britain. Continental Europe, North America and the rest of the world have each grown in importance, in absolute and relative terms, as sources of holiday visitors. Back in 2008 Britain was the top source of holiday visitors accounting for 45% of demand compared to 30% last year. Continental Europeans now top the table of holiday visitors accounting for 41% of demand in 2015 compared to 34% seven years ago. The relative importance of North American holiday visitors has grown from 17% to 23% share over the same period.


Holiday Visitors x Source Market 2008, 2014 & 2015
 
2008
2014
2015
% change
v 2014
% change
v 2008
Britain
1,572,000
978,000
1,172,000
+20%
-25%
Continental Europe
1,196,000
1,304,000
1,600,000
+23%
+34%
North America
596,000
783,000
900,000
+15%
+51%
Rest of World
161,000
196,000
235,000
+20%
+46%


VFR DEMAND

Almost 3 out of every five VFR visitors come from Britain – an estimated 1.3 million in 2015 or 58% of all visits for this purpose. Mainland Europe has been an increasing as a source of VFR demand in over the past decade, reflecting migration patterns, and is now the source of 26% of VFR visits, or almost 600,000 visits. An estimated 360,000 visits to friends and relative originated from long haul source markets last year. The composition of demand by source market showed little change on the previous year with a volume increase of close to 4% across all markets.

Source: CSO


BUSINESS VISITORS

An estimated 1.25 million business visitors last year was an increase of 12% on the previous year. Business visitors from Britain account for almost half of all such visits, increased by approximately 15% in 2015 to an estimated 600,000. Business trips from mainland Europe were up in the region of 10% to an estimated 450,000, while demand from long haul markets rose by close to 30% to approximately 200,000.

Source: CSO


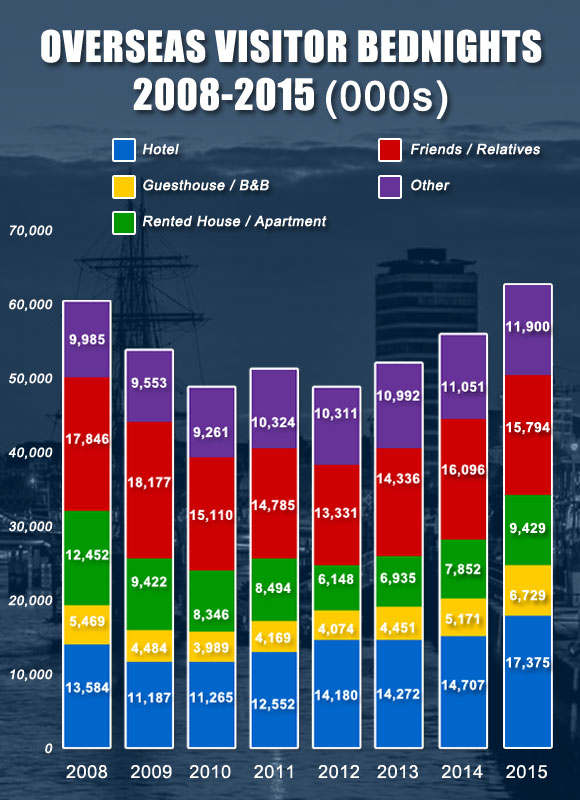
Overseas visitors spent a total of 61 million nights in Ireland in 2015, up 12% resulting in 6 million more nights than the previous year.

Mainland European visitors generated 44% of total bednight demand, with almost 27 million nights, followed by British visitors accounting for 25% at 15 million nights. North American visitors generated 11.7 million bednights with visitors from other long-haul markets spending 7.5 million nights in the country, accounting for 19% and 12% share of demand respectively.


Source: CSO


Holiday visitors accounted for an increasing share of bednights in 2015, up two percentage points to 42%, with VFR accounting for 28%, business 13% and those visiting for ‘other reasons’ 17%.

Bednights from holiday visits increased by 19% year on year, with demand from business visitors up 7% while VFR bednight demand increased by only 2%.

Where did they stay?

It would appear that all accommodation categories, other than ‘staying with friends and relatives’ enjoyed healthy growth in demand from overseas visitors in 2015.

Paid serviced accommodations (Hotels, Guesthouses, and B&Bs) catered to 39% of the demand, while 26% of bednights were spent with friends and relatives. Rented accommodation commanded a 15% share of bednights, with a further 19% spent in other forms of accommodation.

Source: CSO


Hotels sold 2.7 million more bednights to overseas visitors in 2015 than in the previous year, an 18% increase in demand to a total of 17.4 million bed nights. The hotel sector increased its share of total bednight demand by one percentage point to 28%. The growth in demand came primarily from holiday visitors generating 2 million more bednights for hotels, while demand from business and VRF visitors also increased.

Bednight demand for hotels was buoyant across all source markets with demand up close to 20% from most markets.


Source of Hotel Bednight Demand 2013 & 2014
 
2008
2015
Mainland Europe
37%
38%
North America
23%
29%
Britain
35%
25%
Rest of World
5%
8%


Guesthouses and B&Bs experienced a 30% increase in demand in 2015 to an estimated 6.7 million bednights, 1.5 million more than the previous year. The sector enjoyed a 35% fillip in demand from holiday visitors to 4.6 million. The sector experienced consistent growth in demand across all source markets, resulting in its share of total bednights increasing from 9% to 11%.

Rented accommodation experienced a 20% increase in the number of bednights from overseas visitors, to reach 9.4 million, representing a 15% share. Demand from holiday visits increased by 23%, with demand from those visiting for ‘other reasons’, which accounts for almost 50% of demand for the sector, was up 22%. Mainland Europe continues to be largest market for the sector, accounting for just over half of bednight demand, while the rate of growth in demand from long haul markets outpaced the increases from Britain and mainland Europe last year.

Unfortunately the CSO does not provide any analysis of visitation patterns across the regions or distribution of bednights by region. However, based on other data sources and anecdotal evidence it is safe to assume that the pattern of demand for categories of accommodation varies between Dublin, other major tourism hubs, and the rest of the country. Hence the aggregate national picture provided above will not necessarily reflect the experience in every part of the country.


© ITIC | Irish Tourist Industry Confederation | Registered in Dublin | Registered No: 75658 | All Rights Reserved