 |
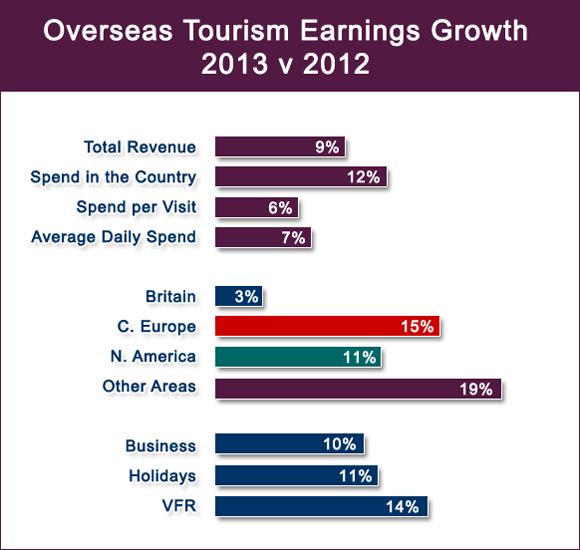
€4.13 billion earned from overseas visitors, including payment to Irish carriers, a 9% year on year increase in current terms. |
|
€3.26 billion spent in the country, a 12% increase in current terms on the
previous year. |
|
€865 million earned by Irish Carriers – surface and air. |
|
€504 average spend per visit, excluding fares paid to Irish carriers, +6% on the
previous year. |
|
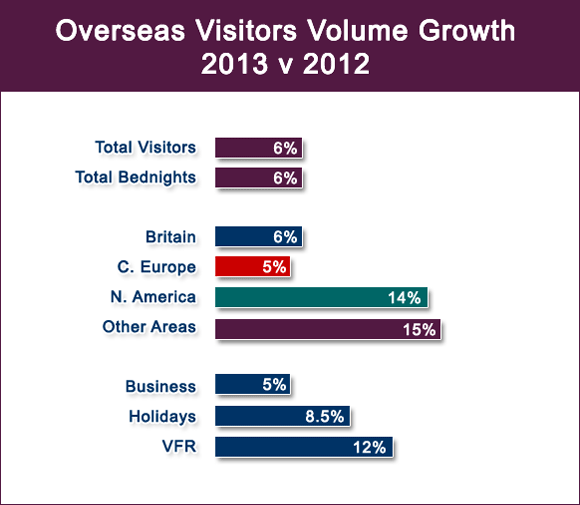
6.4 million overseas visitors, +6% |
|
600,000 same-day visitors, +23% |
|
360,000 more overseas visitors to Ireland in 2013. |
|
7.3 nights was the average length of stay, down marginally from 7.4. |
|
51 million bednights compared to 48 million in 2012, +6%. |
| Source: CSO |
Source: CSO
Source: CSO

|
|

A look behind the data recently released by the CSO release on 2013, coupled with a top line analysis of performance over recent years, shows up some interesting results and challenging trends.
Best year since 2009
2013 produced a level of incremental growth not seen for several years, with aggregate visitor volumes back close to 2009 levels, while earnings are still some way off pre-recession values. The Gathering provided a much needed boost to demand – its success is clearly reflected in the growth in numbers who came to visit friends and relatives (VFR) and for leisure, as was particularly evident from the core diaspora markets of the United States, Britain and further afield. Year on year overall VFR visits increased by 12% while the numbers visiting for holidays increased by 8.5%, with business travel up 5%.
Overseas Visitors to Ireland 2008 - 2013 |
| YEAR |
No. of Visits 000s (1) |
Spend € millions (2) |
Average spend per visit |
Average length of stay (nights) |
| 2008 |
7,288 |
3,834 |
€526 |
8.1 |
| 2009 |
6,470 |
3,410 |
€527 |
7.6 |
| 2010 |
5,700 |
2,976 |
€522 |
7.8 |
| 2011 |
6,023 |
2,864 |
€475 |
7.7 |
| 2012 |
6,039 |
2,882 |
€477 |
7.4 |
| 2013 |
6,396 |
3,227 |
€504 |
7.3 |
Source: CSO
Notes: Due to methodological changes there is a slight discontinuity with
pre-2009 data.
(1) - Visits refer to staying at least overnight (excludes arrivals via Northern Ireland)
(2) - Est. spend for staying visitors excludes fares paid to Irish carriers |
Total earnings from foreign tourists to the Irish economy in 2013 amounted to €4.13 billion, a 9% increase in current terms on 2012. Irish carriers earned an estimated €865 million from visitors travelling to Ireland, a 1% in revenue receipts despite a 6% increase in overall visitors.

|
|

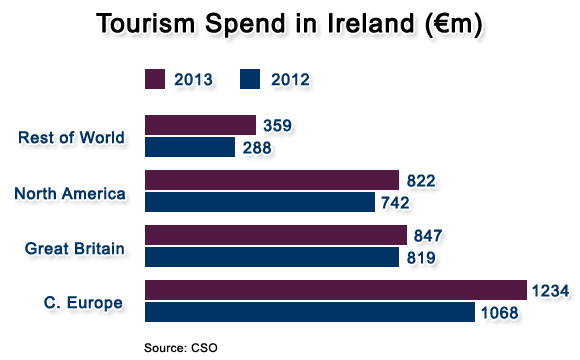
Revenue receipts from the main source markets saw double digit growth in 2013, with the exception of the British market. Mainland Europe continues to be the most valuable source market, cumulatively generating over €1.2 billion in visitor spending in 2013, an increase of 15.5%. British visitors spent €847m in the country, and North Americans spent €822m. Newer long haul markets from around the world accounted for €287m in visitor receipts. For the first time spending by North American visitors came close to receipts earned from the British market.
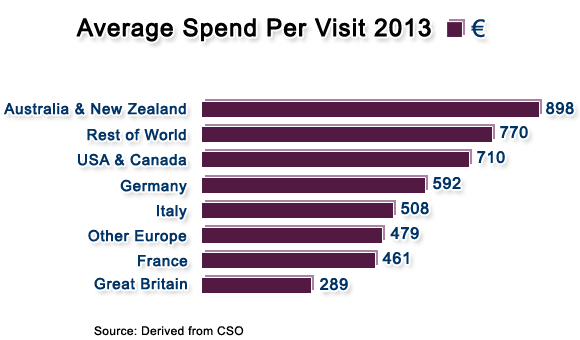
The average spend in 2013 is estimated at €504 per visit, compared to €477 a year earlier. The average spend varies considerably depending on the visitor’s country of origin and purpose of visit. On average a holiday/leisure visitor spent €560 in the country, with business and VFR visitors spending on average €543 and €341 respectively. The highest spenders per trip are visitors from long-haul markets, with Australians and New Zealanders topping the chart at an average of €898, followed by visitors from new emerging long-haul markets spending an average of €770. North American visitors are now in third place in the league of trip expenditure spending an average of €710 in 2013. Germans were the top spenders amongst the European visitors with an average trip expenditure in Ireland of €592, with the majority of other Europeans spending around €500 per visit. British visitors with shorter average stays in the country spent less per trip, an average of close to €290.
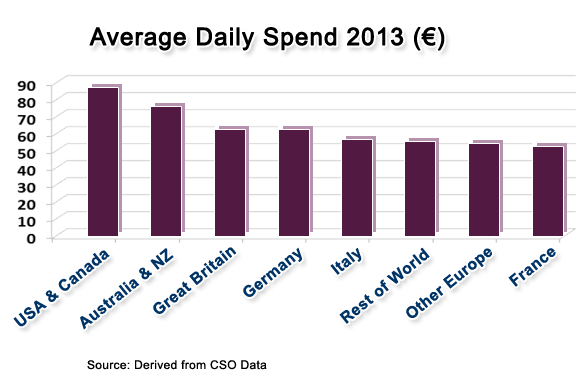
Long haul visitors spent more per day than other visitors, with Americans topping the table at an average of €87 per day, followed by Australians and New Zealanders spending a daily average of €76. Interestingly the average daily expenditure by British visitors, at €62 per day, is higher than that of most mainland European visitors. While the average daily spend illustrated below is a crude measure of the relative value of visitors by source market, the average spend per day is likely to vary considerably by purpose of visit and behaviour across the range of source markets. Unfortunately the published data does not permit a more meaningful analysis of the relative value of each segment of demand - leisure, business, VFR - from each source market.

|
|

Over the past 5 years holiday/leisure visits have not only declined in absolute number but also as a share of total visitors from just over 51% in 2008 to 47% last year, as Ireland has become relatively more dependent on VFR and business visitors during the economic downturn.

The results for 2013 show that
- Leisure visits grew by 8.5% to just over 3 million (3,011,000) and accounted for 47% of the total traffic.
- VFR visits increased by 12% to just under 2 million (1,967,000), representing 31% of the total;
- Business visits increased by 5% to just over 1 million (1.068,000), accounting 17% share;
- Visits for ‘other reasons’ declined by 28% to 350,000, representing 5% of the total.
The main markets vary considerably in relative importance as sources of demand depending on the purpose of visit. In 2013
- Europe continued to be the largest source market for holiday/leisure visits accounting for just over 40% of the total by volume, with a further 30% coming from Britain, 23% from North America and 7% for the rest of the world.
- VFR visitors were predominantly from Britain (60%), with 25% coming from mainland Europe, 9% from North America and 6% from the rest of the world. (The composition of the VFR segment from Europe is likely to include a large number of friends and relatives of foreign residents in Ireland as well as the traditional Irish related traffic).
- Business visitors were principally from Britain (50%), followed by mainland Europe (35%) and long-haul market (15%) – composition by source market largely unchanged from recent years.
|
|

The source of holiday/leisure traffic has shifted with all markets beyond Britain increasing in relative importance in recent years.
Leisure demand from long-haul markets has grown fastest in recent years. The rate of growth in demand from Australia /New Zealand and new emerging long-haul markets has outpaced the rate of increase from other markets, although from a relatively small base, and is now 30% ahead of the 2008 level. Demand for leisure visits from North America has also been particularly strong with double digit annual growth in recent years. The total number of leisure visits from mainland Europe has recovered to the 2008 level, having grown by 6% in 2013. Despite a very welcome 5% turnaround growth in leisure demand from Britain in 2013, that segment of the market is still over 40% below its peak.
Leisure Visitors x Source Market 2008 & 2013 |
| |
2008 |
2013 |
% Change |
| Britain |
1,572,000 |
903,000 |
-43% |
| Mainland Europe |
1,196,000 |
1,202,000 |
nc |
| North America |
596,000 |
692,000 |
+16% |
| Other Areas |
161,000 |
210,000 |
+30% |
| Source: CSO |
|
|

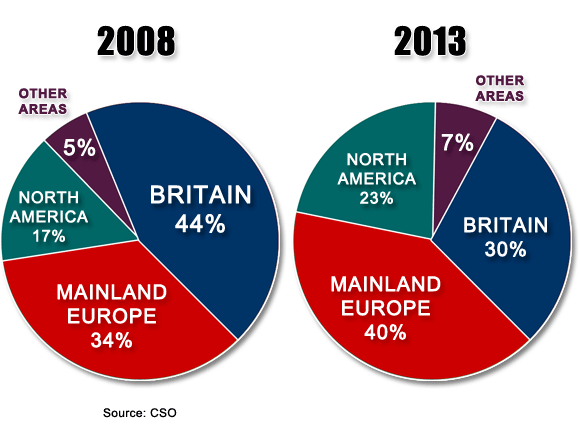
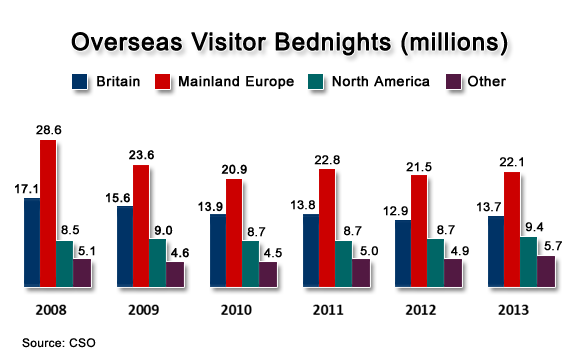
The volume of bednights spent in the country increased by 6% in 2013 to a total of almost 51 million. Changing composition of demand and shorter stays explain the sharp drop from a peak of almost 60 million.
Mainland European visitors generated 43% of total bednight demand, with 22 million nights, followed by British visitors accounting for 27% or almost 14 million. Long-haul markets of North America generated 9.4 million bednights with visitors from other long-haul markets spending 5.7 million nights in the country.
Bednight demand in 2013 showed some interesting shifts, as the average stay of visitors from Other Areas (Australia/New Zealand and new emerging markets), Germany and Britain appear to have increased, while visitors from all other markets continued the trend of shorter stays. The volume of bednight demand from Other Areas was up 16%, reinforcing the established pattern of longer stays from several segments of this source market, including VFR visitors from Australia and New Zealand. Total demand from North America was up 8%, suggesting a decline in the average length of stay from this market, as was also the pattern of demand from mainland Europe.
Perhaps more interesting is the shift in demand between categories of accommodation which occurred in 2013. For the first time in recent years hotels lost out to other forms of accommodation, as bednights spent in hotels remained almost unchanged at just over 14 million, while all other categories appear to have enjoyed increased demand from overseas visitors. The volume of bednights spent with friends and relatives grew by 7.5% to over 14 million, perhaps reflecting impact of the The Gathering, while rented and Guesthouse/B&B accommodations each saw demand increase by 15% and 9% respectively. As a result hotels’ share slipped one percentage point to 28%, while other paid and non-paid accommodations marginally increased their share.
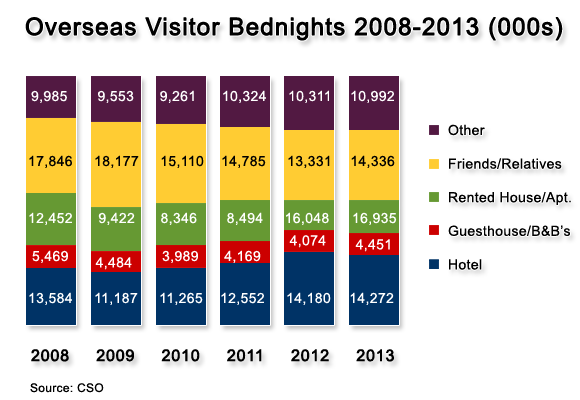
Reflecting the shifts in demand by source markets, mainland Europe now accounts for almost two out of every five overseas bednights in hotels, with North America generating between one in three and one in four bednights. Britain is now the source of one in four hotel bednights.
Source of Hotel Bednight Demand - 2008 & 2013 |
| |
2008 |
2013 |
| Britain |
35% |
25% |
| C. Europe |
37% |
39% |
| N. America |
23% |
28% |
| Other Areas |
5% |
6% |
| Source: CSO |
Unfortunately the CSO data does not provide any analysis of visitation patterns across the regions or distribution of bednights by region. Based on other data sources and anecdotal evidence it is safe to assume that the pattern of demand for categories of accommodation varies between Dublin, other major tourism hubs, and the rest of the country. Hence the aggregate national picture provided above will not necessarily reflect the experience in many parts of the country.
|
|
| © ITIC | Irish Tourist Industry Confederation | Registered in Dublin | Registered No: 75658 | All Rights Reserved |
 |
 |
 |
 |
|
|