
Source: CSO
Source: CSO
|
|
||||||||||||||||||||||||||||||||||||||||||||||||||||||||||||||||||||||||||||||
|
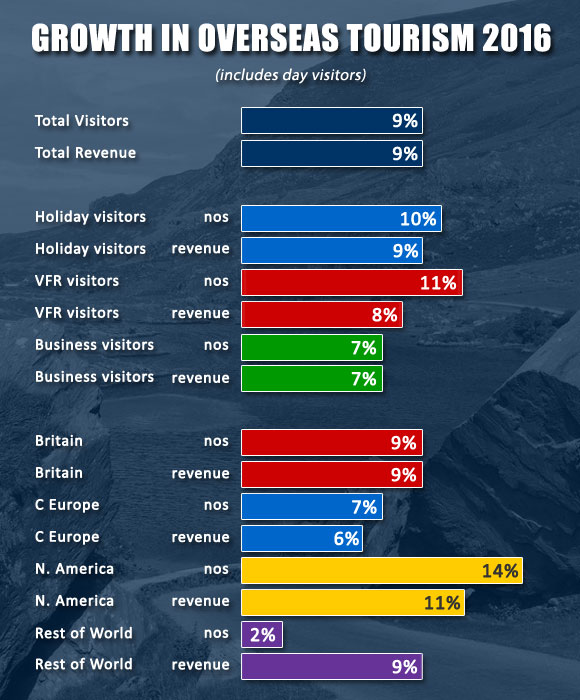
Overseas visitor numbers and revenue hit another high in 2016, the second successive record year in volume and a new earnings record in current terms. After a bumper year of double digit growth in 2015, it is not a surprise that the rate of growth has slowed but at 9% it remains a very strong performance. Encouragingly, available data would suggest that Ireland has continued to win market share from some key source markets. The number of arrivals into the country was up 11% year on year to a record 9.6 million. Visitors staying overnight reached a new high at 8.4 million, up 9% on the previous year. Day visitors, including transfer passengers at Dublin Airport, continued on a fast growth track to reach almost 1.2 million a year on year increase of 29%. The key metric of revenue generated by visitors staying in the country topped €4.5 billion for the first time, an increase of 9% on the previous year. The results for 2016, once again far exceeded official forecasts, as Ireland continued to benefit from a favourable external environment including improved economic and consumer confidence in the main source markets coupled with the strength of the US dollar and the pound sterling up to the time of the Brexit vote. The competitive positioning of the Ireland offering continued to be good, although rising cost pressures risk eating away at competitiveness. The upturn in demand continued to be supported throughout 2016 by an expansionist strategy on the part of airlines offering increased capacity and highly competitive fares, most noticeably from North America and to a lesser degree on services from mainland Europe. The latest CSO data for 2016 - Tourism and Travel Quarter 4 2016 (released March 23, 2017) - provides the basis for a detailed analysis of the demand from overseas which goes beyond monthly visitor head count. The latest quarterly data provides insights into the reason for visit, visitor behaviour and their expenditure including key metrics of length of stay and use of accommodation. Data on regional distribution of overseas tourism within the country should become available over the coming months from Fáilte Ireland’s annual Survey of Travellers research, together with estimates of arrivals by residents of Northern Ireland and overseas visitors who arrive via Northern Ireland. This fragmentation of tourism statistics is an unfortunate systemic weakness of data collection in Ireland and is not ideal for the Irish tourism industry. As income from overseas visitors is the primary metric of the economic benefit of tourism to the country, the latest data shows up some interesting performance data for the past year. €6.1 billion in earnings from overseas tourists in 2016 Aggregate earnings from foreign tourists to the Irish economy in 2016 topped €6 billion for the first time, a 9.5% increase in current terms on 2015. €4.58 billion was spent in the country by staying and day visitors from overseas markets, while Irish carriers earned an estimated €1.48 billion from visitors travelling to Ireland. The average length of stay has fallen marginally below an average of 7 nights per visitor.
|
|
||||||||||||||||||||||||||||||||||||||||||||||||||||||||||||||||||||||||||||||
|
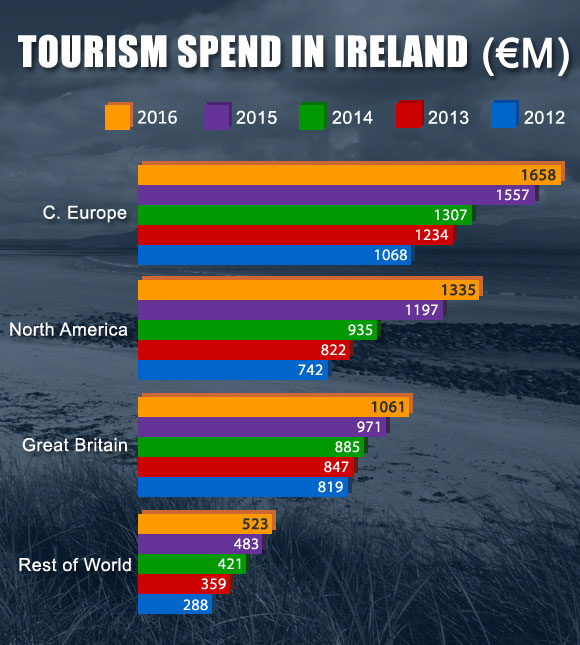
Spending by overnight visitors from overseas increased by €360m to reach over €4.5 billion in 2016, excluding fares paid to Irish carriers. The 9% year on year increase in current terms benefitted businesses throughout the country, albeit that the rate of growth has slowed compared to 2015 when revenue grew by a remarkable 19%. In value terms continental Europe continues to be the most valuable source market netting €1.66 billion, up 6% on the previous year. Visitor spending by North Americans has been growing faster than from other markets in recent years helped by a strong dollar and has increased by 11% to reach €1.3 billion last year. Spending by visitors from Britain reached almost €1.1 billion in 2016, a 9% year on year increase. Earnings from visitors from the rest of the world continued to grow in absolute and relative importance with an 9% increase in receipts to €524 million. Growth in earnings continues to be strongest from long haul markets. Between 2012 and 2016 annual earnings from North America have grown by 80% and from the rest of the world by 81%. In contrast earnings from short haul markets have increased by 44% over the same period, with annual receipts from continental Europeans up 55% and spend by British visitors up 29%. In recent years the return on marketing investment would appear to have been particularly strong from longer haul markets which now account for 23% share of visitors but generate 41% of annual receipts.
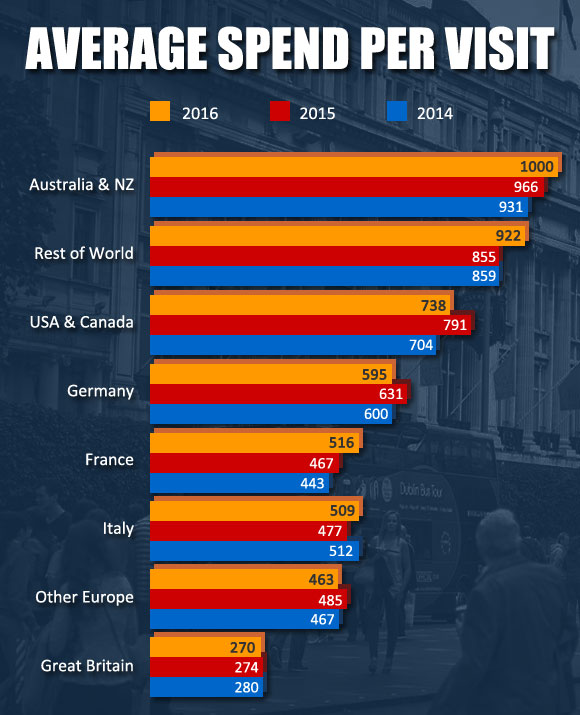
Source: CSO €2.55 billion spent in the country by holiday visitors was up 9% on the previous year and accounted for 56% of total earnings. Expenditure by VFR visitors (visiting friends and relatives) increased by 8% to €864 million, while spending by business visitors was up 7% to €724 million. Average expenditure per visit The average spend per visit in 2016 is estimated at €537 per overseas tourist, unchanged from a year earlier. The average spend varies considerably depending on the visitor’s country of origin and purpose of visit. On average a holiday/leisure visitor spent €580, with business and VFR visitors spending on average €470 and €338 respectively. It would appear that the average expenditure per trip for holiday was marginally down (-3%), while business visitors and VFR average spend declined by 13% and 6% respectively. The drop in average spend can be explained by changes in composition by nationality and a decline in the average length of stay. The highest spenders per trip are visitors from long-haul markets, with Australians and New Zealanders topping the chart at an average of just over €1,000, followed by visitors from new emerging long-haul markets spending on average €922, both markets recording an upward spend in 2016. These visitors tend to combine a longer average stay of 14 days, thanks to the strong ethnic links with Australia and New Zealand, combined with the upscale profile and expenditure of visitors from the new developing long haul markets particularly in Asia. North American visitors are in third place in the league of trip expenditure spending an average of €738 in 2016, up 7% in line with a drop in the average length of stay last year. Germans continue to be top European spenders with an average trip expenditure in Ireland of €595, while the majority of other Europeans spend close to €500 per visit. British visitors with a shorter average stay in the country spend the least per visit, an average of €270, almost unchanged from the previous year. A note of caution may be appropriate as the data is based on sample surveys at point of departure, with the robustness of the data dependent on the accuracy of recall by visitors of their expenditure in the country.
Source: Derived from CSO
|
|
||||||||||||||||||||||||||||||||||||||||||||||||||||||||||||||||||||||||||||||
|
Overseas visitors spending at least one night – their purpose of visit in 2016
|
|
||||||||||||||||||||||||||||||||||||||||||||||||||||||||||||||||||||||||||||||
|
Of the total estimated 4.25 million holiday visitors continental Europe continued to be the largest source with an estimated 1.7 million trips accounting for 40% of the total by volume. Britain is the next largest source of holiday visitors with an estimated 1.3 million trip accounting for 31% of the total. North America at just over 1 million for the first time was the source of 24% of the total, while the rest of the world with 5% share resulted in close to 220,000 trips.
Germany is the top mainland European source market, accounting for 10% of all holiday visits, followed by France the source of 7% of the demand. The absolute and relative importance of the source markets for holidays in Ireland has changed significantly over recent years as demand from Britain declined. Over the past 8 years the shift has occurred as demand grew from markets beyond Britain. Continental Europe, North America and the rest of the world have each increased in importance, in absolute and relative terms, as sources of holiday visitors. Back in 2008 Britain was the top source of holiday visitors accounting for 45% of demand compared to 31% last year. Continental Europeans now top the table of holiday visitors accounting for 39% of demand in 2016 compared to 34% eight years ago. The relative importance of North American holiday visitors has grown from 17% to 24% share over the same period.
VFR DEMAND Almost 3 out of every five VFR visitors come from Britain – an estimated 1.4 million in 2016 or 56% of all visits for this purpose. Mainland Europe has been increasing as a source of VFR demand in over the past decade, reflecting migration patterns, and is now the source of 27% of VFR visits, or almost 670,000 visits. An estimated 400,000 visits to friends and relative originated from long haul source markets last year.
BUSINESS VISITORS An estimated 1.3 million business visitors last year was an increase of 5% on the previous year. Business visitors from Britain, accounting for almost half of all such visits, showed a modest 3% increase to an estimated 620,000. Business trips from mainland Europe at close to an estimated 300,000 showed little year on year change, while demand from long haul markets rose by close to 15% to approximately 225,000.
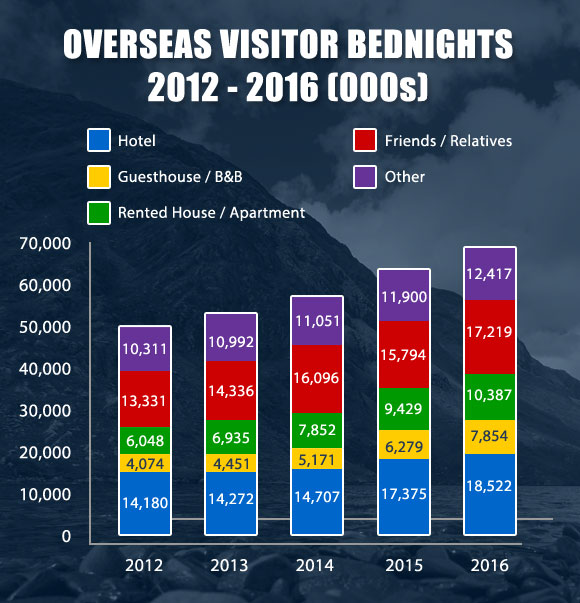
Overseas visitors spent a total of 66 million nights in Ireland in 2016, up 8% resulting in just over 5 million more nights than the previous year. Mainland European visitors generated 44% of total bednight demand, with 29 million nights, followed by British visitors accounting for 25% at 16.4 million nights. North American visitors generated 13 million bednights with visitors from other long-haul markets spending 7.9 million nights in the country, accounting for 19% and 12% share of demand respectively.
Source: CSO The relative share of bednights by purpose of visit remained unchanged from the previous year with holiday visitors accounting for 42%, VFR 28%, with business and those visiting for ‘other reasons’ at 13% and 17% respectively. Bednights from holiday visits and VFR each increased by 9% year on year, with demand from business visitors up 15%. What type of accommodation did tourists experience? It would appear that demand for Guesthouse/B&Bs and rented categories enjoyed the highest rate of increase in 2016, up 17% and 10% respectively. Hotels catered to a 7% increase in overseas visitor nights, while nights spent with friends and relatives up 9% and ‘other accommodation’ up 4%. Paid serviced accommodations (Hotels, Guesthouses, and B&Bs) catered to 40% of the demand, while 26% of bednights were spent with friends and relatives. Rented accommodation commanded a 15% share of bednights, with a further 19% spent in other forms of accommodation.
Source: CSO Hotels sold 1.15 million more bednights to overseas visitors in 2016 than in the previous year, an 7% increase in demand to a total of 18.5 million bed nights. The hotel sector’s share of total bednight demand slipped marginally, perhaps a reflection of the high occupancy rate and demand outpacing supply in top tourism hubs, including Dublin. Guesthouses and B&Bs experienced a 17% increase in demand in 2016 to an estimated 7.8 million bednights, 1.1 million more than the previous year. The sector enjoyed a 19% fillip in demand from holiday visitors to 5.5 million. The sector again experienced consistent growth in demand across all source markets, resulting in its share of total bednights increasing from 9% in 2014 to 12% in 2016. Rented accommodation experienced a 10% increase in the number of bednights from overseas visitors, to reach 10.4 million, representing a 16% share. Demand from holiday visits increased by 10%, while demand from those visiting for ‘other reasons’, which accounts for 46% of demand for the sector, was up 6%, as demand from business visitors also increased. Mainland Europe continues to be largest market for the sector, accounting for just over half of bednight demand, while the rate of growth in demand from new developing long haul markets outpaced the increases from other source markets. Unfortunately the CSO does not provide any analysis of visitation patterns across the regions or distribution of bednights by region. However, based on other data sources and anecdotal evidence it is safe to assume that the pattern of demand for categories of accommodation varies between Dublin, other major tourism hubs, and the rest of the country. Hence the aggregate national picture provided above will not necessarily reflect the experience in every part of the country.
|
|
||||||||||||||||||||||||||||||||||||||||||||||||||||||||||||||||||||||||||||||
|
The latest CSO release is the first opportunity to look at the performance of the British market in the final quarter of the year to see if Brexit and the drop in the value of sterling impacted on visitation patterns and expenditure. While the value of sterling dropped by up to 15% after the result of the Brexit referendum on June 23, it is reasonable to assume that the bulk of travel for the second half of 2016 was already committed. Brexit's real impact will be felt in 2017 as was evident from CSO tourism numbers released on March 29th for January and February this year. However looking at the last quarter in 2016 some analysis includes:
It should be noted that the triggering of Article 50 and the formal commencement of Brexit negotiations only happened on March 29th 2017. Therefore the impact of Brexit and its implications for Irish tourism will be felt most keenly from this year on. ITIC's analysis of the seriousness of Brexit and what it means for the Irish tourism industry can be accessed here.
|
|
||||||||||||||||||||||||||||||||||||||||||||||||||||||||||||||||||||||||||||||
|
|||||||||||||||||||||||||||||||||||||||||||||||||||||||||||||||||||||||||||||||